
Productivity Audit: Measure Output & Performance
Run a data-backed productivity audit with automatic tracking, AI productivity analysis, and weekly report generation.
What is a productivity audit?
A productivity audit is a systematic evaluation of your workflows, tools, and how you actually allocate time across work that matters — not just whether you're busy, but where output breaks down and why.
Most professionals lose 2–3 hours daily to invisible friction: context switching, unclear priorities, and work that feels productive but produces nothing shippable. Manual self-reports capture what you remember, not what actually happened.
Didon captures a structured baseline from real activity, so your productivity audit starts with data instead of guesswork.
- Time allocation: where hours actually go versus where you think they go
- Tool fragmentation: how many context switches happen per hour
- Priority alignment: whether daily work connects to your actual goals
- Output rate: time spent versus work completed or shipped
“What gets measured gets managed.”
The Five Productivity Audits Every Team Needs
Productivity problems cluster in predictable places. Run these five structured audits to find where the real drag is.
Priorities Audit
Compare Didon's project breakdown against your stated goals. If a goal isn't in the time log, it's not actually a priority.
Meeting Audit
Calculate meeting time as a percentage of working hours. Recurring sessions without a defined outcome are candidates for removal.
Task Audit
Split work into deep, shallow, and administrative buckets. Most people underestimate admin overhead until they see the numbers.
Friction Audit
Find repeated tool-switching patterns. Five cycles between Slack, Jira, and GitHub per hour means something in the workflow is forcing it.
Direct Report Audit
For managers: what percentage of each person's time went to work only they can do? Under 50% means coordination overhead, not a personal problem.
| Audit | What It Measures | How to Capture It |
|---|---|---|
| Priorities | Goal-to-time alignment | Didon project breakdown vs. OKRs |
| Meetings | Meeting load as % of work hours | Calendar export + time log |
| Task | Deep / shallow / admin split | Didon category breakdown |
| Friction | Tool-switching frequency | Didon activity timeline |
| Direct report | High-leverage time per member | Didon team logs + 1:1 review |
KPIs That Measure Real Output
Hours logged is not output. Track the KPIs that reveal whether anything useful got done.
Output KPIs
- • Completed tasks per sprint or week
- • Features shipped, tickets resolved, PRs merged
- • Client deliverables delivered on schedule
Efficiency KPIs
- • Cycle time: task start to completion
- • Ratio of deep work hours to total logged hours
- • Context switches per day
Quality KPIs
- • Bug count post-release
- • Rework rate on completed tasks
- • Client revision requests per project
Didon maps activity to projects and generates weekly productivity reports showing time distribution across categories — not just totals. You see the ratio of focused work to overhead without building a spreadsheet.
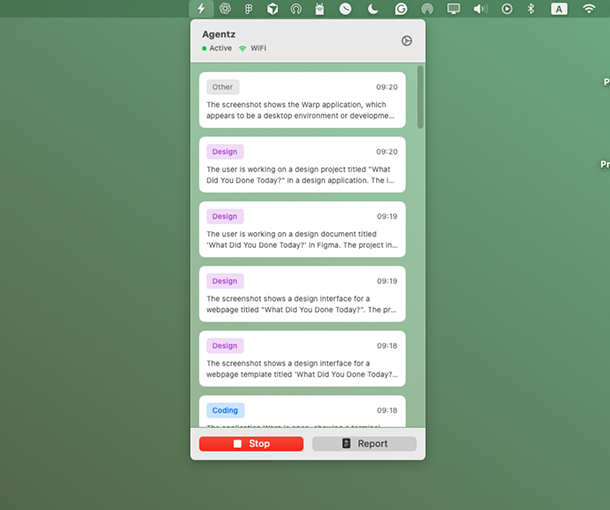
Weekly productivity report preview — placeholder
Productivity score & report generation
Your productivity score summarizes each day from focus time, task completion, and distraction patterns — a single number that makes trends visible without drowning in data.
Didon's AI productivity report generation runs automatically: daily journals, weekly summaries, and category breakdowns built from on-device analysis. Export CSV for team dashboards or quarterly reviews.
No end-of-week reconstruction. No spreadsheet assembly. The audit data is there when you need it — assembled from real activity, not memory.
- Daily productivity score built from focus time and distraction patterns
- Automatic AI productivity report generation — daily journals and weekly summaries
- Project and category breakdowns for audit-ready data
- CSV export for team dashboards and quarterly reviews
- Peak focus hours and context-switch counts surfaced automatically
AI Adoption Metrics Beyond Token Counts
Token leaderboards corrupt the data you'd use to make better decisions. Track AI productivity signals that actually matter.
Weekly Active User Growth
1–3% week-over-week during scaling indicates healthy AI adoption — not token volume.
Returning User Retention
Above 80% means the tool solves a real problem. Dropping retention signals workflow fit issues.
New User Activation
Steady first-time user streams beat launch spikes that flatline — sustainable adoption over hype.
Modality Expansion
Users applying AI across multiple workflows over time — not stuck on a single use case.
| KPI | Healthy Signal | Warning Signal |
|---|---|---|
| WoW WAU growth | 1–3% per week during scaling | Below 0.5% for 4+ consecutive weeks |
| New user activation | Steady first-time user stream | Spikes only at launch, then flat |
| Returning user retention | Above 80% | Dropping week-over-week |
| Modality expansion | AI across multiple workflows | Single use case, no spread |
How Didon Runs a Productivity Audit Automatically
Every 30 seconds, Didon captures activity and analyzes it on-device. By end of week, you have a full audit without doing a single audit task.
Passive Capture
Didon captures screenshots every 30 seconds and analyzes them on-device. Nothing leaves your Mac or Windows — no cloud upload, no manual timer.
Local AI Analysis
On-device AI matches activity to your projects and categories, building a structured daily journal in the background.
Audit Reports
Weekly summaries surface time per project, category distribution, peak focus hours, and context-switch counts — your productivity audit, done.
| Audit Method | Setup | Ongoing Effort | Accuracy |
|---|---|---|---|
| Manual time log | Low | High (daily) | Low |
| Traditional timer apps | Medium | Medium | Medium |
| Didon automatic tracking | Low | None | High |
Coming soon: the AI Productivity Coach reads audit patterns and sends accountability nudges when drift is detected.
Turn Audit Findings Into a Repeatable System
Finding problems is easy. Most audits stall at the insight stage. Here's how to close the gap.
Two Weeks of Data
Let Didon build an accurate baseline — actual hours per project, real context-switch frequency, and where your day fragments.
Find the Largest Leak
Don't fix everything at once. Find the one category eating disproportionate time — meetings, Slack, or low-priority tasks.
Change One Thing
Implement one intervention, wait two to three weeks, and check whether tracked time in that category actually shifted.
Quarterly Re-Audits
Use Didon's comparison views to run quarterly checks: current period against baseline, category by category.
FAQ
Common questions about productivity audits, scores, and AI report generation.
What You Measure Is What You Improve
Manual productivity audits fail because they rely on memory. You sit down on Friday and try to reconstruct a week from Slack threads and calendar entries. The result is incomplete — and usually flattering in ways reality wouldn't support.
Continuous measurement fixes this. When AI productivity tracking runs automatically in the background, the data is there when you need it. A complete audit pulls from output KPIs, AI adoption metrics, and friction analysis — together revealing where time creates value and where it quietly disappears.
Why AI Productivity Audits Beat Self-Reporting
Research shows people misjudge how long tasks take by up to 40%. Self-reported time estimates make any audit built on memory unreliable from the start. Passive tracking with on-device AI is more accurate than any manual method — people consistently misremember where time went, sometimes by hours per day.
Didon handles the measurement layer automatically. It captures activity every 30 seconds, runs analysis locally on your Mac or Windows, and generates structured daily summaries and weekly productivity reports without manual input. Start with one week: install Didon, let it run, and read the summary on Friday. You'll see your actual workday — not the one you think you had.